
Understanding the behavior of electromagnetic waves is crucial for studying transmission lines.
In this article, we will explore the techniques and tools employed to visualize TEM waves on transmission lines, offering a glimpse into the realm of electromagnetic energy in motion.
You can watch the quick video or read along. Just click here.
Overview of Transmission Line
We know that , the Transmission line carry electric energy from one point to another in an electric power system.
It is used for the transmission of electrical power from generating substation to the various distribution units
The transmission line is the most important concept we study in electromagnetics.
When EM wave travels through the waveguide or any transmission line, then it is called as guided wave propagation.
MOst of the students failed to visualize that , how EM wave is established over the transmission line.
So, let us visualize in the given article, that how EM wave is established in the transmission line.
Visualization of TEM wave over the transmission line
Let us understand this , with the help of the diagram.
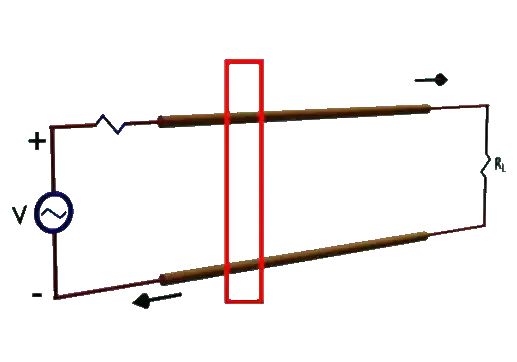
Consider the two transmission lines which is made up of perfect conductor. The medium between these two conductors is perfect dielectric. Assume that we are supplying high-frequency voltage source to the transmission line and delivering power to the load at the load end.

We know the transmission lines are very long. It’s length could be in km. Now, let us visualize how TEM wave over the transmission line.
As we have applied the high-frequency voltage source , the current will flow through the transmission line. We will consider any particular instant of time.
Let us take that the upper line is at positive potential and the lower line is at negative potential.
We know that when current flows through any conductor or wire, the magnetic field ‘H’ is set up around that conductor. The direction of this magnetic field will be given by the right-hand thumb rule. According to the Right-hand thumb rule, the thumb denotes the direction of current and the fingers denote the nature of the magnetic field surrounding the conductor.
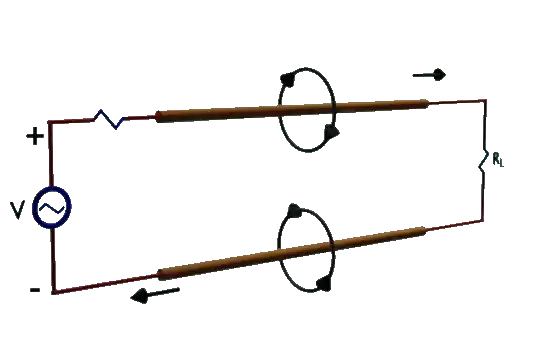
In the upper line, the current is set up and it is coming toward the load. But in the lower line, the magnetic field will be set up according to the right-hand thumb rule. As the current starts flowing, the magnetic field will be set up in the transmission line.
The magnetic field is set up between the dielectric medium present between these two lines. Between these two lines, there is a presence of the electromagnetic field. The positive charge is building up in the upper wire and the negative charge is building up in the lower wire.
As the electric field is directed from positive to negative, the electric field will be set up between these two lines.
When we apply the high-frequency voltage source to the transmission lines, we get the electric field and magnetic field. So, when the high-frequency voltage source is applied, the transverse electric field and the transverse magnetic field is set up in the transmission line created between the medium.
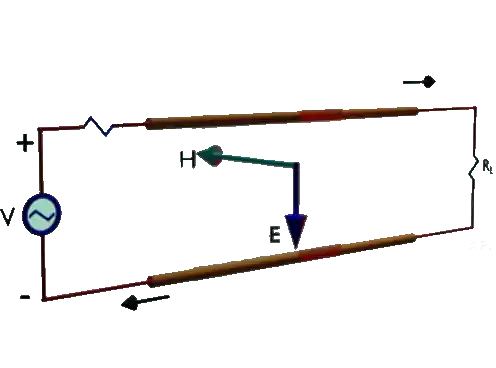
In general, transverse means perpendicular. So, it will be perpendicular to the direction of propagation. Therefore, the E and H which is created are called as transverse E and H . The E and H both lie on the transverse plane.
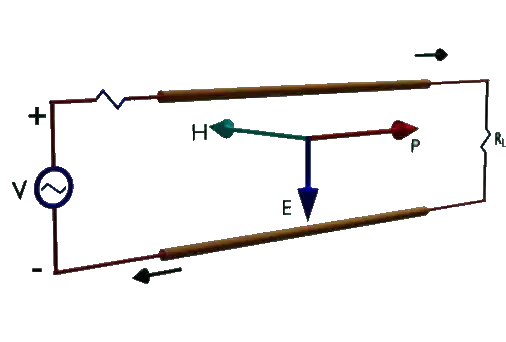
Concluding this, we can say that when the high-frequency voltage source is applied to the transmission line, the transverse E and transverse H is created between the medium present between these two lines. This transverse E and transverse H is nothing but the TEM wave ( Tranverse electromagnetic wave ). Because of this, power is propagated from the source end to the load end.
This is the visualization of TEM over the transmission line.
Now, let us summarize this, so, we can say that
∎ TEM wave is present within the dielectric material between wires.
∎ Because of high-frequency electromagnetic wave , high-frequency power is carried out from source to load.
Therefore, in this way,we can visualize the TEM wave over the transmission line.
Hope, this article has made your concept clear and now you can able to visualize a TEM wave over the transmission line.
Do not forget to check our Awesome GATE courses.